The atmosphere,
under observation.
Investigating atmospheric optical depth, UV absorption, seasonal variability, and Earth system relationships across Punjab.
Aerosol optical depth is increasing over the selected record. This is an area-averaged satellite signal, not a measurement of ground-level pollution or proof of a cause.
Aerosol optical depth through time
MODIS Aqua · MYD08_M3 V6.1 · 70.5°E–75.5°E, 28.5°N–33.5°N
Area-averaged monthly retrievals. Annual values use available months; coverage is listed below.
Season-adjusted trend and 95% confidence band
Amber fitted trend · blue deseasonalized monthly values · pointwise OLS mean-fit band
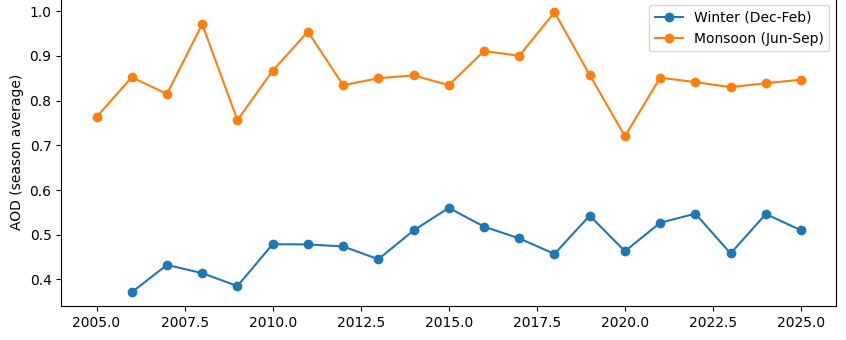
Monsoon versus winter
Winter Dec–Feb · monsoon Jun–Sep · means of valid selected months
Annual AOD grid
MODIS Terra MOD08_M3 · measured 1° cells · 11 annual maps
Two instruments, one winter signal
AOD (MODIS) and Aerosol Index (OMI) both rise significantly in winter, and neither changes significantly in the monsoon. Supplied monthly correlation: r = 0.34.
Consistent with growing smoke and pollution in winter; satellite data alone can't prove the source.
Monthly climatology
Aerosol optical depth: seasonal contrast between monsoon and winter, 2005 – 2025
Dimensionless AOD at 0.55 μm · supplied seasonal figure · MODIS Aqua MYD08_M3
Annual means & data coverage
| Year | Mean AOD | Months | Coverage |
|---|---|---|---|
| 2005-01-01 | 0.541718 | 12/12 | Eligible annual mean |
| 2006-01-01 | 0.612731 | 12/12 | Eligible annual mean |
| 2007-01-01 | 0.584378 | 12/12 | Eligible annual mean |
| 2008-01-01 | 0.660212 | 12/12 | Eligible annual mean |
| 2009-01-01 | 0.572899 | 12/12 | Eligible annual mean |
| 2010-01-01 | 0.631847 | 12/12 | Eligible annual mean |
| 2011-01-01 | 0.626845 | 12/12 | Eligible annual mean |
| 2012-01-01 | 0.627245 | 12/12 | Eligible annual mean |
| 2013-01-01 | 0.622724 | 12/12 | Eligible annual mean |
| 2014-01-01 | 0.633946 | 12/12 | Eligible annual mean |
| 2015-01-01 | 0.627940 | 12/12 | Eligible annual mean |
| 2016-01-01 | 0.671288 | 12/12 | Eligible annual mean |
| 2017-01-01 | 0.653396 | 12/12 | Eligible annual mean |
| 2018-01-01 | 0.718559 | 12/12 | Eligible annual mean |
| 2019-01-01 | 0.613435 | 12/12 | Eligible annual mean |
| 2020-01-01 | 0.549953 | 12/12 | Eligible annual mean |
| 2021-01-01 | 0.682461 | 12/12 | Eligible annual mean |
| 2022-01-01 | 0.660888 | 12/12 | Eligible annual mean |
| 2023-01-01 | 0.646541 | 12/12 | Eligible annual mean |
| 2024-01-01 | 0.651425 | 12/12 | Eligible annual mean |
| 2025-01-01 | 0.631487 | 12/12 | Eligible annual mean |